
Market Report for week of November 23rd, 2015.
The Holiday Season is upon us – how time flies.
Last week was nothing short of amazing as the SPX immediately started moving higher at the open Monday and ended up with the best week of the year.
Maybe they were trying to front-run the seasonally strongest time of the year?
Before we get too excited it’s important to understand that for all the drama the Dow, S&P and Russell are essentially flat on the year. Only the NASDAQ has a respectable gain to show so far. Of course that largely due to the FANG stocks, which quite frankly makes me a bit nervous.
The fact that 4 stocks essentially account for the bulk of the gains and that they’ve achieved a sort of cult status isn’t all that healthy when you take a step back and think about it. We really want to see the market broaden out and we want to see the smaller stocks start to participate. This is the time of year that typically happens so we have something to look forward to.
Its interesting to note that only 52% of SPX stocks are above their 200-day moving average.
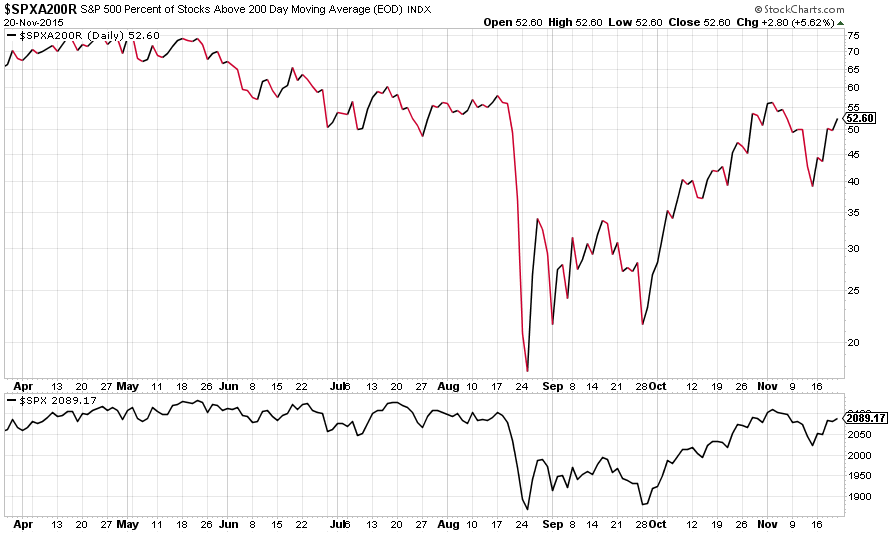
This is considerably less than earlier in the year when the market was essentially moving sideways. It illustrates how narrow the market has been recently. With the market close to new highs it would be constructive if this number improves.
Narrow markets with bad breadth just aren’t healthy in the longer-run.
As we enter Thanksgiving week the 17/43 ema configuration on the 60-minute chart has turned positive once again.
Here’s a look at the 60-minute chart with notes.
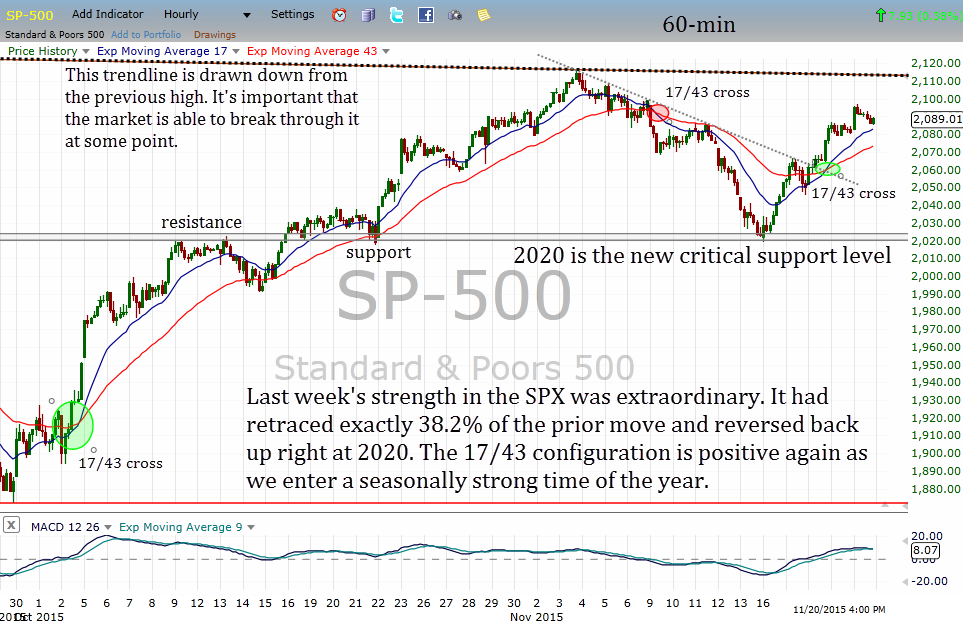
The new “all-important” level now is 2020. It’s acted as support and resistance several times now and as we see on the chart above, it’s the major line in the sand.
The downward-sloping trendline at the top is very important because it comes off the prior high from July 20th and it must get broken to the upside for this market to really get anywhere.
Speaking of which, last Thanksgiving the SPX closed at 2067. Last Christmas Eve it closed at 2081. With Friday’s close of 2089 it’s easy to see why I say it’s really gone nowhere in a year.
Here’s where everything stands year to date.
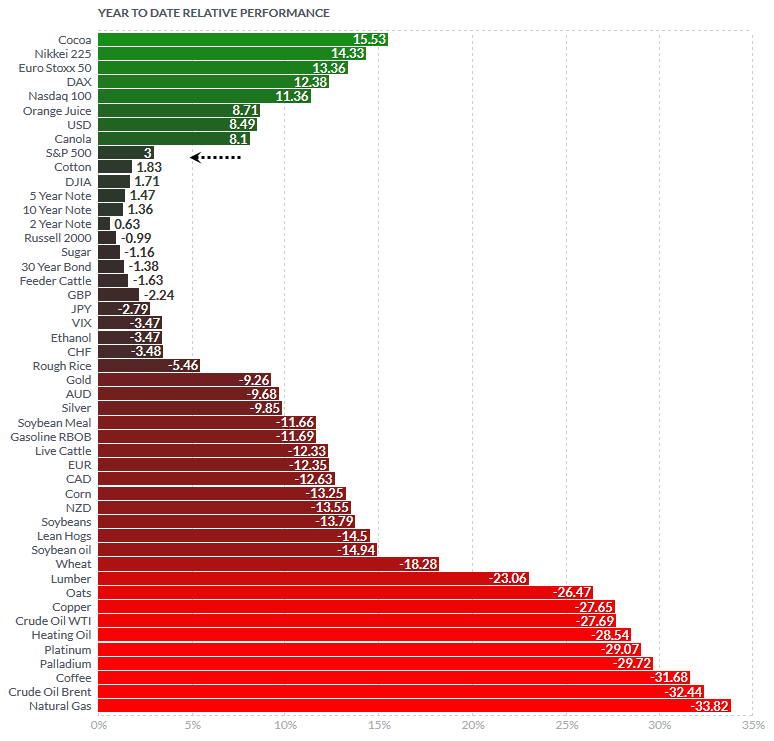
It’s shocking to see the losses in the various commodities down at the bottom of that graph. Even with the dollar index up 8.5% it’s hard to get a good grasp on why these commodities have been hit so hard.
But of course as I mentioned last week we’ve heard a lot of talk about an “industrial recession” and it’s really hard to make sense out of it all.
Commodities have been crushed, a handful of stocks are holding up the indexes, which are essentially flat on the year – but up near all-time highs.
A strange environment indeed.
Throw in the fact that we had a –12% correction that was blamed on a slowdown in China (or global growth – take your pick) and then we’ve rebounded as if that problem is solved. What’s more almost every sell-off in the market the past couple years was attributed to the fact that the Fed “might” raise interest rates sooner than later and all of a sudden there’s a 75% chance they raise next month.
I want to say maybe a rate hike is priced in at this point but everywhere I look people are still saying that they won’t raise rates. At this point it’s hard to tell if they will or won’t and what the reaction will be. If they don’t raise it will be a sign that things aren’t as well as they would like us to think and if they do then they are raising rates in an economy that’s only growing in the 1-2% GDP range, which isn’t exactly “robust”.
And if they do raise rates it will likely have a detrimental effect on other economies around the world.
All in all it’s a mess of sorts – as far as the macro picture.
But stocks are doing their thing and on a day to day basis that macro stuff doesn’t really seem to matter a lot – until the day it does.
We’ve seen a ton of volatility in individual stocks and sectors but earnings season is finally winding down in a big way. So we can get back to the charts without having to worry so much about upcoming earnings.
Oil is hovering right around 40 and the energy stocks are one of the sectors I’ve been keen on – for when oil rebounds. Right now almost every energy stock has a downward-sloping trendline that will have to be broken at some point. It’s hard to know when oil might rebound back to the mid-40’s but when it does, the energy stocks will be the plays for sure. Right now they may continue to languish, which is fine.
Unfortunately we have an open trade in CPG which may hit the stop if oil doesn’t bounce this week. But it’s a tight stop and will be offset by the open trade in AMBA, which is moving nicely in our favor.
Last week I brought quite a few decent ideas to the shows but never got a chance to post them as Stocks to Watch in the Trade setups. I’ll be honest. I spent most of last week working on the new version of the Research Lab as I’m trying to get everything finalized so I can launch it by the end of the year.
But this weekend I did manage to post a handful of good setups that are worth watching and you can see them here posted in the chart feed.
This new version of the Research Lab I’m working on will streamline the process for me posting charts like those. The idea is that the new version will have what I’m calling the “Chart Feed” and I will be posting new ideas and follow-ups to previous charts much more frequently – as in every day and most evenings.
Everything is getting streamlined and simplified and I know you are really going to like the new version. The process of creating it is a huge job and it’s been my main focus for a few weeks now. Since I spend most evenings working on that I’ve been bringing most of the chart ideas to the live shows instead of posting them on the inside. But the main reason for the rebuild is to make it a snap to get charts up for everyone to see on the fly. I needed a way to streamline that and I’ve got it now.
“A constant flow of good chart setups and trading ideas” is what we will have in this new version. Just a few more things to iron out and I’ll be ready to roll it out to you.
In the mean time as we get into Holiday mode I think the market should offer plenty of opportunities and I’ll be starting a new trade or two this week. I mentioned CC as one of my favorite ideas Friday on the show and I posted the chart at the link above. I think I’ll go ahead and take that one because of the huge potential.
With the Holiday shortened week I know people will be busy but I’ll be here looking for new ideas and bring them to you as I can.
I’ll have an update on AMBA before the open Monday so check that out.
Please join me for the live shows and I’ll go over all the charts that I think are worth watching.
See you there!
| Member Home |